Articles / LORQAI
The Ocean Arrived as a Stack of Numbers
How Marie Tharp found a hidden valley beneath the Atlantic — and helped redraw the planet without seeing most of the seafloor.
Marie Tharp transformed scattered ocean-depth measurements into maps that revealed a hidden valley beneath the Atlantic. Her discovery helped scientists rethink the structure of the Earth.
By LORQAI
The Refrigerator and the False Abyss
The Atlantic Ocean occasionally appeared to have no bottom.
This was not a new geological theory. It was a problem with the ship's refrigerator.
Marie Tharp, who spent years reconstructing the shape of the ocean floor from research-vessel measurements, later recalled an unfortunate feature of the early echo-sounding equipment: when somebody opened the refrigerator aboard one ship, the electrical supply to the measuring instrument was interrupted.
Without a returning echo, the recording system could produce an apparent depth that was not a depth at all.
The ocean had not suddenly become infinitely deep. Somebody had wanted something cold.
This was one of the less glamorous difficulties involved in making the first detailed maps of a world that almost nobody had seen.
The instruments produced measurements. Ships followed irregular routes. Storms interrupted surveys. Observations arrived on paper, frequently with gaps and errors. Some measurements were reliable; others were less so.
From this collection of incomplete information, Tharp had to work out what the landscape underneath thousands of metres of water actually looked like.
In the early 1950s, she began noticing a peculiar feature in profiles crossing the Atlantic: a deep notch running through the centre of an enormous underwater mountain range.
One notch might have been a local formation. Several, appearing in corresponding positions across widely separated profiles, suggested something else.
Tharp suspected a continuous valley running along the crest of the Mid-Atlantic Ridge.
That interpretation was difficult for her colleagues to accept. It suggested that the ocean floor, long regarded by many geologists as comparatively stable, might contain a great fracture associated with the movement of Earth's outer shell.
The discovery helped open the way to modern plate tectonics.
It began, however, with a rather less imposing assignment.
Make sense of these numbers.
A Landscape Nobody Could Simply Look At
Before the middle of the twentieth century, scientists already knew that the ocean floor was not perfectly flat.
Nineteenth-century surveys had identified deep areas and submerged rises. In the 1850s, Matthew Fontaine Maury mapped a broad elevation in the North Atlantic using a comparatively small collection of depth measurements. The HMS *Challenger* expedition of the 1870s gathered further evidence of underwater relief.
But isolated depth measurements were not the same thing as a detailed picture.
Imagine trying to describe the Rocky Mountains after travelling across them on six widely separated railway lines. You could record the heights and valleys along each route. You might identify a mountain range. But the enormous regions between those lines would remain uncertain.
Now remove the ability to see beyond the train.
That was closer to the difficulty facing oceanographers.
A ship could measure the depth beneath its route, but the ocean gave researchers few opportunities to look sideways at the terrain. They could not simply climb a neighbouring hill and check whether a depression continued into the distance.
Earlier methods used weighted lines lowered from ships. Echo sounding changed the scale of the undertaking.
A sound pulse travelled downward through the water, reflected from the seabed and returned to a receiver. By measuring the round-trip travel time and using an estimate of the speed of sound in seawater, researchers could calculate the depth.
The distance was not measured by watching the seabed. It was inferred from the behaviour of sound.
Continuous recording instruments could gather measurements along a vessel's route, producing a profile rather than an isolated point. Refinements in instrumentation and navigation made such records progressively more useful.
Nevertheless, each ship collected information along its particular path.
The sea between those paths remained mostly unmeasured.
In 1948, Tharp joined the research community that became Columbia University's Lamont Geological Observatory. She had studied geology and mathematics, but her first assignment was technical drafting.
Bruce Heezen, a young oceanographer working with Maurice Ewing's group, participated in the research expeditions that collected much of the data she would use.
The division of labour was also shaped by the customs of the time. Women were excluded from many research cruises, leaving Tharp to work on land while male colleagues travelled to sea.
She would eventually sail on a research expedition in 1968.
During the years when the most consequential early maps were being made, though, the Atlantic reached her principally through measurements.
There were thousands of them.
And they did not come conveniently arranged into mountains.
Six Crossings
At Lamont, Tharp worked with a drafter named Hester Haring to plot ocean-depth records on standardized map sheets.
The process was laborious. A sounding had a location and a depth. Those values needed to be transferred to the appropriate positions, compared with the original records and checked for inconsistencies.
The ship tracks were not tidy.
Research vessels followed routes determined by scientific priorities, available fuel, weather and operational requirements. Viewed together on a chart, their journeys could form an irregular web of intersecting lines.
Tharp recalled spending weeks organizing the profiles into a form that would permit meaningful comparisons.
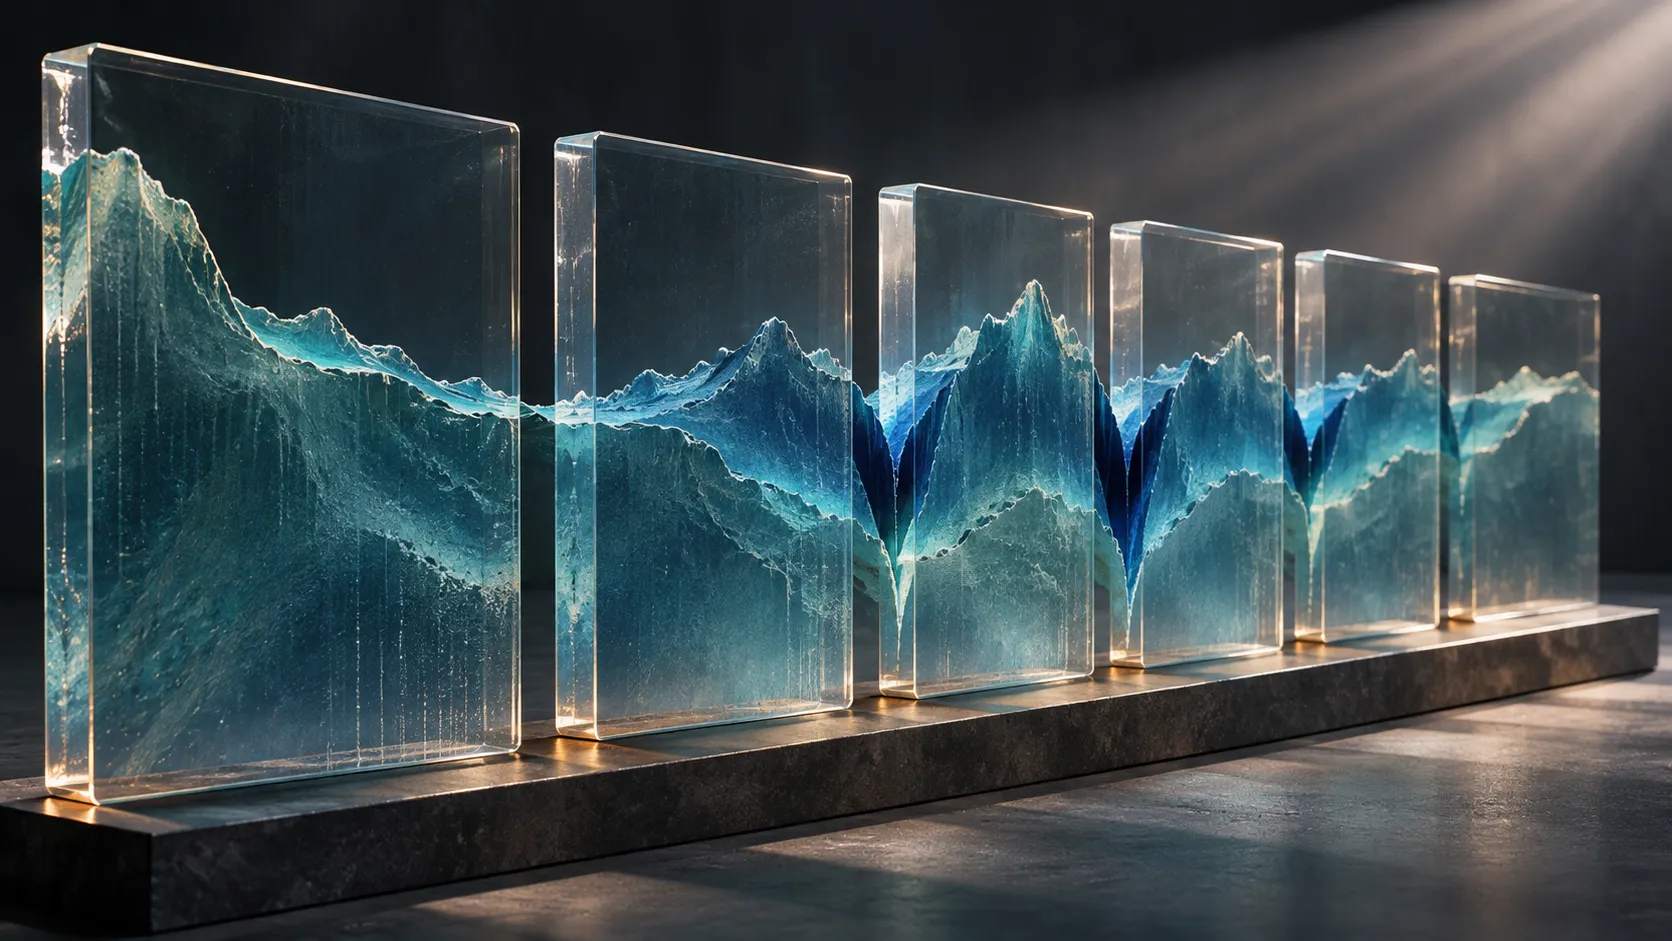
Eventually she had six roughly parallel crossings of the North Atlantic, running from west to east.
Each profile represented a slice of the seabed.
On one, the bottom descended from a continental margin into deep water, rose across the great central ridge and descended again. Another showed a broadly comparable pattern, although individual mountains and valleys differed.
When Tharp placed the profiles in relation to one another, she noticed that a particular feature kept returning.
Near the middle of the ridge, the seabed dropped into a V-shaped depression.
The individual peaks did not line up convincingly across the different sections. The notch did, especially in the three northernmost profiles.
This was the crucial distinction.
If the depression belonged to a single isolated valley, it should not necessarily appear in corresponding positions along widely separated crossings. If it was part of a continuous rift, the repetition made sense.
Tharp proposed the second explanation.
A valley, possibly extending for an immense distance, appeared to run along the top of an underwater mountain range.
That was an extraordinary arrangement.
Mountain ranges on land can contain deep valleys and fractures, of course. But the proposed feature mattered because it occurred at the centre of a ridge extending across an ocean basin, in a period when continental drift remained deeply controversial.
Alfred Wegener had proposed that continents moved relative to one another decades earlier. There was substantial debate about the evidence and, particularly, about the mechanism that could make such movement possible.
The idea of an active ocean floor was not part of the accepted framework of many American geologists.
When Tharp showed Heezen her interpretation, he initially dismissed it.
In her retrospective account, she remembered him referring to the idea as *girl talk*.
The phrase is revealing, but it should not become a substitute for understanding what happened next.
Heezen's scepticism combined a disagreement about geological interpretation with the unequal professional circumstances in which Tharp worked. It also meant the proposed valley would require stronger evidence than a convincing pattern in several hand-drawn profiles.
Tharp continued examining the measurements.
The ocean, meanwhile, was supplying another kind of evidence.
The Second Map
At a nearby table, Howard Foster was working on a different problem.
Foster, a deaf graduate of the Boston School of Fine Arts, had been employed to plot earthquake locations. The data had practical connections to the risks facing submarine cables, but they also offered a way of examining activity within the Earth's crust.
Plotting earthquake epicentres was itself a painstaking task.
Locations had to be transferred from records to maps. The measurements were imperfect, and some positions carried substantial uncertainty.
The earthquake map did not show mountains.
The depth profiles did not show earthquakes.
Neither dataset, considered separately, could settle all the questions about the ocean floor.
But the two projects shared something important: their maps had been prepared at compatible scales.
That made a comparison possible.
When the earthquake locations were placed over the developing map of the Mid-Atlantic Ridge, the pattern was striking.
The epicentres followed a band associated with the central depression.
It was not an exact line of perfect measurements. Some earthquake locations were uncertain by large distances, and the historical records were not precise enough to establish every feature in fine detail.
But the correspondence was too suggestive to ignore.
A topographic feature inferred from underwater soundings appeared to coincide with a zone of seismic activity derived from a different source.
The suspected valley was no longer merely a shape Tharp thought she could see in the profiles.
It was associated with a separate physical phenomenon.
Tharp later recalled that Heezen accepted the rift-valley interpretation by the middle of 1953, several months after she had assembled the original profiles.
The distinction matters. The growing evidence did not instantly settle every argument about continental drift, and Heezen did not immediately embrace the whole theory.
Scientists could agree that a rift existed while disagreeing about what had created it.
A valley could be accepted as a landform before its role in a moving planetary crust was understood.
For Tharp, the correlation strengthened the case for a continuous feature. For the larger scientific community, it offered a geographical clue that demanded explanation.
What kind of process could create a mountain range beneath an ocean, split it along its crest and concentrate earthquakes near the resulting valley?
The maps had identified a problem that the prevailing picture of the Earth could not comfortably contain.
Drawing Across the Empty Spaces
Finding the rift was one challenge. Turning the available measurements into a readable map of the entire Atlantic was another.
The difference between a depth profile and a map is enormous.
A profile represents a narrow section along a route. A map presents an extensive area as though the landforms between those sections are known.
Tharp and Heezen developed physiographic diagrams, a form of cartography that presents terrain with the apparent depth and relief of an oblique view.
Rather than showing only contour lines, such illustrations made undersea ridges, valleys, plains and scarps visually comprehensible.
The technique was also practical. Detailed naval bathymetric contour maps were subject to restrictions, while physiographic diagrams offered a way to communicate an interpretation of the seabed to a much wider audience.
Tharp's procedure combined several distinct stages.
First came plotting the ship tracks and their soundings. Next she drew profiles of the seafloor beneath those tracks. Then she translated the profiles into representations of three-dimensional terrain.
The largest difficulty lay between the tracks.
No instrument had measured every point.
To draw a continuous landscape, the cartographers had to extend geological patterns across regions where observations were sparse or absent.
Tharp did not conceal this.
In her own account, she acknowledged that parts of the work depended on educated extrapolation, while new measurements could force the team to revise earlier interpretations.
This is an essential distinction between a scientific reconstruction and an invented landscape.
A reconstruction draws on physical evidence and makes assumptions that can be tested when further evidence becomes available. It is not a photograph. Its apparent completeness should never be confused with complete observation.
Even the best map of an incompletely surveyed region contains different degrees of certainty.
Tharp's working methods reflected this problem. She described records graded according to their reliability and map sheets filled with annotations, comparisons and corrections.
Some of the measurements were much better than others.
The maps also changed as new forms of the terrain emerged.
An apparently continuous valley acquired offsets. Fracture zones revealed how sections of the ridge were displaced relative to one another. Earlier interpretations of the Indian Ocean were corrected when additional evidence exposed features that had not been recognized.
The act of mapping was not a single moment of discovery followed by years of colouring in details.
It was an extended process of testing the landscape against incoming evidence.
One might imagine that the greatest danger in drawing the unknown ocean was leaving too much blank paper.
In fact, the greater danger was making an uncertain region look more certain than the measurements justified.
A good map had to be useful enough to reveal patterns and honest enough to remain revisable.
Recognition, Resistance and a Moving Planet
As more ocean-floor data accumulated, the emerging ridge system extended beyond the Atlantic.
Related features appeared in the Indian Ocean and other ocean basins. Earthquake locations traced additional parts of the system.
The continental margins, submerged mountain ranges, faults and trenches were gradually being assembled into a far more complicated planetary picture.
Heezen and Maurice Ewing presented findings about the extensive mid-ocean ridge and rift system at a scientific meeting in 1956. The Atlantic physiographic maps became widely known during the later 1950s.
The exact publication chronology requires care. Tharp's own account describes an early North Atlantic diagram appearing in 1956 in connection with the *Bell System Technical Journal*, while major institutional catalogues identify the landmark Atlantic map with 1957.
What matters for the scientific narrative is that the work had become visible beyond the drafting rooms at Lamont.
Other researchers could examine it.
The proposed rift was also tested by direct observation. Tharp described Jacques Cousteau's expedition crossing the Atlantic and obtaining underwater film in the region of the predicted valley, providing additional support for its existence.
Still, identifying the rift was not equivalent to establishing the complete mechanism of plate tectonics.
Several lines of research converged over the following years.
Harry Hess and others developed explanations of seafloor spreading. Magnetic patterns recorded in oceanic crust helped researchers understand the creation and movement of the seafloor. Improved earthquake observations revealed the boundaries and motions of large portions of Earth's outer shell.
By the late 1960s and early 1970s, plate tectonics had transformed the earth sciences.
Tharp's maps belonged to that convergence of evidence.
They were crucial because they made the distribution of major seafloor features visible and helped connect the ridge system with zones of seismic activity.
Yet they were not the achievement of one scientist working in isolation from every other discipline.
Heezen contributed shipboard research, interpretation and access to data. Foster's earthquake plotting helped reveal the correlation. Haring's meticulous recordkeeping supported the cartographic work. Ewing's programme and the researchers developing instruments and surveys made the measurements possible.
Later, oceanographers and geophysicists working on magnetism, earthquakes and seafloor dynamics supplied evidence that helped explain what the maps depicted.
Tharp's personal contribution remained extraordinary within that collective process.
She recognized the recurring depression, persisted when her interpretation was rejected and transformed fragmented measurements into a form in which patterns could be examined by others.
For much of her career, her role received less public recognition than that of male colleagues.
Scientific recognition, like scientific evidence, did not arrive all at once.
The World Map and Its Missing Parts
In 1977, a celebrated panoramic map of the world's ocean floor appeared.
It was the product of a long collaboration among Tharp, Heezen and Heinrich Berann, an Austrian artist whose experience painting Alpine landscapes brought a distinctive visual approach to the submarine world.
The map showed an Earth whose oceans were filled with mountains, trenches, ridges and immense plains.
Its ambition was extraordinary.
The oceans cover most of the planet's surface. Yet the measured tracks from research vessels still represented only a small portion of that expanse.
The artists and scientists therefore had to combine observational data, geological interpretation and visual judgment.
Tharp described travelling to Austria to work with Berann as new information became available. Sections of the painting were developed, reconsidered and revised.
The map was not complete because every square kilometre of the seabed had been observed.
It was complete as a global scientific interpretation of the evidence available at the time.
Tragically, Heezen died in 1977 while aboard a research submarine, shortly before the panorama was published.
The map became one of the most recognizable images in the history of modern oceanography.
It also invites an important question.
How should we look at a scientific image that appears to reveal an entire unseen landscape when much of that landscape was reconstructed from limited measurements?
The answer is neither to distrust the whole image nor to treat it as an exact photograph.
Its strength lies in the relationship between evidence and interpretation.
The major ridge systems and other large-scale features could be examined and refined against further observations. Areas represented more tentatively remained open to correction.
That is how the map could be both scientifically significant and imperfect.
The world it depicted did not become less remarkable because the data were incomplete.
Its authors simply refused to treat incompleteness as a reason to stop investigating.
The Line That Wasn't on the Ship's Route
It is tempting to end Tharp's story with the great 1977 panorama.
The entire ocean spread across a map, its hidden mountain systems finally displayed in colour: a suitable final image for a long career.
But the earlier pencil and ink work offers a better way of understanding what she actually discovered.
Consider those six Atlantic profiles again.
Each described the seabed along a narrow route followed by a ship. None of the ships had travelled the full length of the central rift valley. Their tracks crossed it at separated places.
The valley itself was not delivered as a single measurement.
It emerged from relationships among measurements.
The profiles suggested a repeated landform. The earthquake map revealed a corresponding seismic pattern. Later surveys and observations tested and extended the interpretation.
What Tharp recognized was not merely the presence of an underwater depression.
She recognized that separate fragments of information might belong to the same enormous structure.
That is a different kind of seeing from looking through a window.
A window presents the objects within its field of view. Tharp's maps had to describe a world beyond the reach of any one instrument, vessel or observer.
The drawings were not substitutes for evidence. They were a means of organizing evidence into questions that could be answered.
In the Atlantic, the most important feature was a valley that no single survey track had followed from beginning to end.
The ships had crossed it.
Tharp drew it running between them.